
Statistics (सांख्यिकी)
Get “Statistics” chapter’s previous years questions from 2009 to 2020.
Q1. What do we call the graph which has been drawn between class interval and cumulative frequency?
{वर्ग अंतराल और संचयी बारंबारता के बीच खींचे गए आलेख को क्या कहते हैं?}
[su_spoiler title=”year 2019, 2016, 2013 of 1 marks” style=”simple” anchor_in_url=”yes”][/su_spoiler]
Ans. Ogive or cumulative frequency curve
{तोरण या संचयी बारंबारता वक्र}
Q2. The cumulative frequency curve is also called …
{संचयी बारंबारता वक्र को … भी कहते हैं|}
[su_spoiler title=”year 2018, 2015 of 1 marks” style=”simple” anchor_in_url=”yes”][/su_spoiler]
Ans. Ogive
{तोरण}
Q3. What type of ogive do we call a graph which has been drawn between lower limits of class interval and cumulative frequency?
{वर्ग अंतराल की निम्न सीमाओं और संचयी बारंबारता के बीच खींचे गए आलेख को किस प्रकार के तोरण कहते हैं?}
[su_spoiler title=”year 2014 of 1 marks” style=”simple” anchor_in_url=”yes”][/su_spoiler]
Ans. More than type ogive.
{से अधिक प्रकार का तोरण है|}
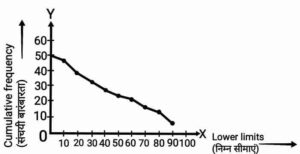
Q4. Which type of ogive is it?
{यह किस प्रकार का तोरण है?}
 [su_spoiler title=”year 2020, 2017, 2012 of 1 marks” style=”simple” anchor_in_url=”yes”][/su_spoiler]
Ans. More than type ogive.
{से अधिक प्रकार का तोरण है|}
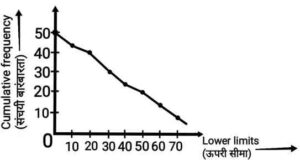
Q5. What type of ogive is the following figure?
{निम्न चित्र किस प्रकार का तोरण है?}
 [su_spoiler title=”year 2009 of 1 marks” style=”simple” anchor_in_url=”yes”][/su_spoiler]
Ans. More than type ogive.
{से अधिक प्रकार का तोरण है|}
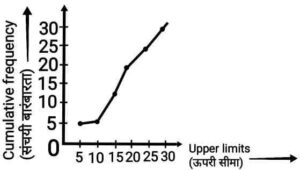
Q6. What type of ogive is the following figure?
{निम्न चित्र किस प्रकार का तोरण है?}
 [su_spoiler title=”year 2010 of 1 marks” style=”simple” anchor_in_url=”yes”][/su_spoiler]
Ans. Less than type ogive.
{से कम प्रकार का तोरण है|}
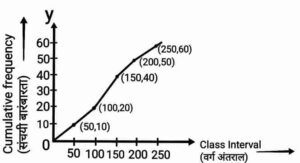
Q7. Write the class interval of the cumulative frequency 20 from the ogive given below.
नीचे दिए गए तोरण से संचयी बारंबारता 20 का वर्ग अंतराल लिखिए|}
 [su_spoiler title=”year 2011 of 1 marks” style=”simple” anchor_in_url=”yes”][/su_spoiler]
Ans. 50-100
Q8. Find the mean of the following data:
| Class interval | 45-55 | 55-65 | 65-75 | 75-85 | 85-95 |
| Frequency | 3 | 10 | 11 | 8 | 3 |
{निम्न आँकड़ो से माध्य ज्ञात कीजिये
| वर्ग अंतराल | 45-55 | 55-65 | 65-75 | 75-85 | 85-95 |
| बारंबारता | 3 | 10 | 11 | 8 | 3 |
[su_spoiler title=”year 2020 of 6 marks” style=”simple” anchor_in_url=”yes”][/su_spoiler]
Ans.
| Class interval | Frequency(fi) | Class-mark(xi) | [Frequency×Class-mark](fixi) |
| 45-55 | 3 | 50 | 150 |
| 55-65 | 10 | 60 | 600 |
| 65-75 | 11 | 70 | 770 |
| 75-85 | 8 | 80 | 640 |
| 85-95 | 3 | 90 | 270 |
| Total |
Mean=
{
| वर्ग अंतराल | बारंबारता(fi) | वर्ग चिह्न(xi) | [बारंबारता×वर्ग चिह्न](fixi) |
| 45-55 | 3 | 50 | 150 |
| 55-65 | 10 | 60 | 600 |
| 65-75 | 11 | 70 | 770 |
| 75-85 | 8 | 80 | 640 |
| 85-95 | 3 | 90 | 270 |
| योग |
माध्य= }
Q9. Find the mean of the following data:
| Class interval | 10-25 | 25-40 | 40-55 | 55-70 | 70-85 | 85-100 |
| Frequency | 2 | 3 | 7 | 6 | 6 | 6 |
{निम्न आँकड़ो से माध्य ज्ञात कीजिये
| वर्ग अंतराल | 10-25 | 25-40 | 40-55 | 55-70 | 70-85 | 85-100 |
| बारंबारता | 2 | 3 | 7 | 6 | 6 | 6 |
[su_spoiler title=”year 2019 of 6 marks” style=”simple” anchor_in_url=”yes”][/su_spoiler]
Ans.
| Class intertval | Frequency(fi) | Class-mark(xi) | [Frequency×Class-mark](fixi) |
| 10-25 | 2 | 17.5 | 35 |
| 25-40 | 3 | 32.5 | 97.5 |
| 40-55 | 7 | 47.5 | 332.5 |
| 55-70 | 6 | 62.5 | 375 |
| 70-85 | 6 | 77.5 | 465 |
| 85-100 | 6 | 92.5 | 555 |
| Total |
Mean=
{
| वर्ग अंतराल | बारंबारता(fi) | वर्ग चिह्न(xi) | [बारंबारता×वर्ग चिह्न](fixi) |
| 10-25 | 2 | 17.5 | 35 |
| 25-40 | 3 | 32.5 | 97.5 |
| 40-55 | 7 | 47.5 | 332.5 |
| 55-70 | 6 | 62.5 | 375 |
| 70-85 | 6 | 77.5 | 465 |
| 85-100 | 6 | 92.5 | 555 |
| योग |
माध्य=}
Q10. Find the median of the following data:
| Class interval | 0-10 | 10-20 | 20-30 | 30-40 | 40-50 | 50-60 | 60-70 |
| Frequency | 5 | 10 | 18 | 30 | 20 | 12 | 5 |
{निम्न आँकड़ो से माध्यक ज्ञात कीजिये
| वर्ग अंतराल | 0-10 | 10-20 | 20-30 | 30-40 | 40-50 | 50-60 | 60-70 |
| बारंबारता | 5 | 10 | 18 | 30 | 20 | 12 | 5 |
[su_spoiler title=”year 2020,2014 of 6 marks” style=”simple” anchor_in_url=”yes”][/su_spoiler]
Ans.
| Class intertval | Frequency(f) | Cumulative Frequency(cf) |
| 0-10 | 5 | 5 |
| 10-20 | 10 | 15 |
| 20-30 | 18 | 33 |
| 30-40 | 30 | 63 |
| 40-50 | 20 | 83 |
| 50-60 | 12 | 95 |
| 60-70 | 5 | 100 |
Now,
30-40 is the class whose cumulative frequency 63 is greater than and nearest to 50.
So, 30-40 is the median class.
Here, l=30, f=30, cf=33 and
h=40-30=10
∴ Median=
{
| वर्ग अंतराल | बारंबारता(f) | संचयी बारंबारता(cf) |
| 0-10 | 5 | 5 |
| 10-20 | 10 | 15 |
| 20-30 | 18 | 33 |
| 30-40 | 30 | 63 |
| 40-50 | 20 | 83 |
| 50-60 | 12 | 95 |
| 60-70 | 5 | 100 |
अब,
30-40 वह वर्ग है जिसकी संचयी बारंबारता 63 है और वह 50 से अधिक और निकटतम है।
अतः माध्यक वर्ग=30-40
यहाँ, l=30, f=30, cf=33,
और h=40-30=10
∴ माध्यक=
}
Q11. Find the median of the following data:
| Class intertval | 0-10 | 10-20 | 20-30 | 30-40 | 40-50 | 50-60 |
| Frequency | 5 | 8 | 20 | 15 | 7 | 5 |
{निम्न आँकड़ो से माध्यक ज्ञात कीजिये
| वर्ग अंतराल | 0-10 | 10-20 | 20-30 | 30-40 | 40-50 | 50-60 |
| बारंबारता | 5 | 8 | 20 | 15 | 7 | 5 |
[su_spoiler title=”year 2019,2009 of 6 marks” style=”simple” anchor_in_url=”yes”][/su_spoiler]
Ans.
| Class intertval | Frequency(f) | Cumulative Frequency(cf) |
| 0-10 | 5 | 5 |
| 10-20 | 8 | 13 |
| 20-30 | 20 | 33 |
| 30-40 | 15 | 48 |
| 40-50 | 7 | 55 |
| 50-60 | 5 | 60 |
Now,
20-30 is the class whose cumulative frequency 33 is greater than and nearest to 30.
So, 20-30 is the median class.
Here, l=20, f=20, cf=13 and
h=30-20=10
∴ Median=
{
| वर्ग अंतराल | बारंबारता(f) | संचयी बारंबारता(cf) |
| 0-10 | 5 | 5 |
| 10-20 | 8 | 13 |
| 20-30 | 20 | 33 |
| 30-40 | 15 | 48 |
| 40-50 | 7 | 55 |
| 50-60 | 5 | 60 |
अब,
20-30 वह वर्ग है जिसकी संचयी बारंबारता 33 है और वह 30 से अधिक और निकटतम है।
अतः माध्यक वर्ग=20-30
यहाँ, l=20, f=20, cf=13 और
h=30-20=10
∴ माध्यक=
}
Q12. Find the median of the following data:
| Class interval | 40-45 | 45-50 | 50-55 | 55-60 | 60-65 | 65-70 | 70-75 |
| Frequency | 2 | 3 | 8 | 6 | 6 | 3 | 2 |
{निम्न आँकड़ो से माध्यक ज्ञात कीजिये
| वर्ग अंतराल | 40-45 | 45-50 | 50-55 | 55-60 | 60-65 | 65-70 | 70-75 |
| बारंबारता | 2 | 3 | 8 | 6 | 6 | 3 | 2 |
[su_spoiler title=”year 2018,2015,2012 of 6 marks” style=”simple” anchor_in_url=”yes”][/su_spoiler]
Ans.
| Class interval | Frequency(f) | Cumulative Frequency(cf) |
| 40-45 | 2 | 2 |
| 45-50 | 3 | 5 |
| 50-55 | 8 | 13 |
| 55-60 | 6 | 19 |
| 60-65 | 6 | 25 |
| 65-70 | 3 | 28 |
| 70-75 | 2 | 30 |
Now,
55-60 is the class whose cumulative frequency 19 is greater than and nearest to 15.
So, 55-60 is the median class.
Here, l=55, f=6, cf=13 and
h=60-55=5
∴ Median=
{
| वर्ग अंतराल | बारंबारता(f) | संचयी बारंबारता(cf) |
| 40-45 | 2 | 2 |
| 45-50 | 3 | 5 |
| 50-55 | 8 | 13 |
| 55-60 | 6 | 19 |
| 60-65 | 6 | 25 |
| 65-70 | 3 | 28 |
| 70-75 | 2 | 30 |
अब,
55-60 वह वर्ग है जिसकी संचयी बारंबारता 19 है और वह 15 से अधिक और निकटतम है।
अतः माध्यक वर्ग=55-60
यहाँ, l=55, f=6, cf=13 और
h=60-55=5
∴ माध्यक=
}
Q13. Find the median of the following data:
| Class interval | 65-85 | 85-105 | 105-125 | 125-145 | 145-165 | 165-185 | 185-205 |
| Frequency | 4 | 5 | 13 | 20 | 14 | 8 | 4 |
{निम्न आँकड़ो से माध्यक ज्ञात कीजिये
| वर्ग अंतराल | 65-85 | 85-105 | 105-125 | 125-145 | 145-165 | 165-185 | 185-205 |
| बारंबारता | 4 | 5 | 13 | 20 | 14 | 8 | 4 |
[su_spoiler title=”year 2013 of 6 marks” style=”simple” anchor_in_url=”yes”][/su_spoiler]
Ans.
| Class interval | Frequency(f) | Cumulative Frequency(cf) |
| 65-85 | 4 | 4 |
| 85-105 | 5 | 9 |
| 105-125 | 13 | 22 |
| 125-145 | 20 | 42 |
| 145-165 | 14 | 56 |
| 165-185 | 8 | 64 |
| 185-205 | 4 | 68 |
Now,
125-145 is the class whose cumulative frequency 42 is greater than and nearest to 34.
So, 125-145 is the median class.
Here, l=125, f=20, cf=22 and
h=145-125=20
∴ Median=
{
| वर्ग अंतराल | बारंबारता(f) | संचयी बारंबारता(cf) |
| 65-85 | 4 | 4 |
| 85-105 | 5 | 9 |
| 105-125 | 13 | 22 |
| 125-145 | 20 | 42 |
| 145-165 | 14 | 56 |
| 165-185 | 8 | 64 |
| 185-205 | 4 | 68 |
अब,
यहाँ, l=125, f=20, cf=22 और
h=145-125=20
∴ माध्यक=
}
Q14 Find the mode of the following data:
| Class interval | 65-85 | 85-105 | 105-125 | 125-145 | 145-165 | 165-185 | 185-205 |
| Frequency | 4 | 5 | 13 | 20 | 14 | 8 | 4 |
{निम्न आँकड़ो से बहुलक ज्ञात कीजिये
| वर्ग अंतराल | 65-85 | 85-105 | 105-125 | 125-145 | 145-165 | 165-185 | 185-205 |
| बारंबारता | 4 | 5 | 13 | 20 | 14 | 8 | 4 |
[su_spoiler title=”year 2016,2010 of 6 marks” style=”simple” anchor_in_url=”yes”][/su_spoiler]
Ans. The maximum class frequency is 20.
So, modal class=125-145,
Here, l=125, f1=20, f2=14, f0=13,
h=145-125=20
∴ Mode=
{अधिकतम वर्ग बारंबारता 20 है|
तो, बहुलक वर्ग=125-145,
यहाँ, l=125, f1=20, f2=14, f0=13,
h=145-125=20
∴ बहुलक=
}
Q15. Find the mean or median (any one) of the following data:
| Class interval | 65-85 | 85-105 | 105-125 | 125-145 | 145-165 | 165-185 | 185-205 |
| Frequency | 4 | 5 | 13 | 20 | 14 | 8 | 4 |
{निम्न आँकड़ो से माध्य अथवा माध्यक (कोई एक) ज्ञात कीजिये
| वर्ग अंतराल | 65-85 | 85-105 | 105-125 | 125-145 | 145-165 | 165-185 | 185-205 |
| बारंबारता | 4 | 5 | 13 | 20 | 14 | 8 | 4 |
[su_spoiler title=”year 2017 of 6 marks” style=”simple” anchor_in_url=”yes”][/su_spoiler]
Ans.
MEAN
| Class interval | Frequency(fi) | Class-mark(xi) | [Frequency×Class-mark](fixi) |
| 65-85 | 4 | 75 | 300 |
| 85-105 | 5 | 95 | 475 |
| 105-125 | 13 | 115 | 1495 |
| 125-145 | 20 | 135 | 2700 |
| 145-165 | 14 | 155 | 2170 |
| 165-185 | 8 | 175 | 1400 |
| 185-205 | 4 | 195 | 780 |
| Total |
Mean=
OR
MEDIAN
| Class interval | Frequency(f) | Cumulative Frequency(cf) |
| 65-85 | 4 | 4 |
| 85-105 | 5 | 9 |
| 105-125 | 13 | 22 |
| 125-145 | 20 | 42 |
| 145-165 | 14 | 56 |
| 165-185 | 8 | 64 |
| 185-205 | 4 | 68 |
Now,
125-145 is the class whose cumulative frequency 42 is greater than and nearest to 34.
So, 125-145 is the median class
Here, l=125, f=20, cf=22 and
h=145-125=20
∴ Median=
{
माध्य
| वर्ग अंतराल | बारंबारता(fi) | वर्ग चिह्न(xi) | [बारंबारता×वर्ग चिह्न](fixi) |
| 65-85 | 4 | 75 | 300 |
| 85-105 | 5 | 95 | 475 |
| 105-125 | 13 | 115 | 1495 |
| 125-145 | 20 | 135 | 2700 |
| 145-165 | 14 | 155 | 2170 |
| 165-185 | 8 | 175 | 1400 |
| 185-205 | 4 | 195 | 780 |
| योग |
माध्य=
OR
माध्यक
| वर्ग अंतराल | बारंबारता(f) | संचयी बारंबारता(cf) |
| 65-85 | 4 | 4 |
| 85-105 | 5 | 9 |
| 105-125 | 13 | 22 |
| 125-145 | 20 | 42 |
| 145-165 | 14 | 56 |
| 165-185 | 8 | 64 |
| 185-205 | 4 | 68 |
अब,
125-145 वह वर्ग है जिसकी संचयी बारंबारता 42 है और वह 34 से अधिक और निकटतम है।
अतः माध्यक वर्ग=125-145
यहाँ, l=125, f=20, cf=22 और h=145-125=20
∴ माध्यक=
}
Q16. A life insurance agent found the following data for the distribution of ages of 100 policy folders. Determine the median age, if policies are only given the persons having age 18 years onwards but less than 60 years.
| Ages(in years) | Numbers of policy holders |
| Below 20 | 2 |
| Below 25 | 6 |
| Below 30 | 24 |
| Below 35 | 45 |
| Below 40 | 78 |
| Below 45 | 89 |
| Below 50 | 92 |
| Below 55 | 98 |
| Below 60 | 100 |
{एक जीवन बीमा एजेंट 100 पॉलिसी धारकों की आयु के बंटन के निम्नलिखित आँकड़े ज्ञात करता है| माध्यिका आयु ज्ञात कीजिये, यदि पॉलिसी केवल उन्हीं व्यक्तियों को दी जाती हैं, जिनकी आयु 18 वर्ष या उससे अधिक हो, परन्तु 60 वर्ष से कम हो|}
| आयु(वर्षों में) | पॉलिसी धारकों की संख्या |
| 20 से कम | 2 |
| 25 से कम | 6 |
| 30 से कम | 24 |
| 35 से कम | 45 |
| 40 से कम | 78 |
| 45 से कम | 89 |
| 50 से कम | 92 |
| 55 से कम | 98 |
| 60 से कम | 100 |
[su_spoiler title=”year 2011 of 6 marks” style=”simple” anchor_in_url=”yes”][/su_spoiler]
Ans.
| Class interval | Frequency(f) | Cumulative Frequency(cf) |
| Below 20 | 2 | 2 |
| 20-25 | 4 | 6 |
| 25-30 | 18 | 24 |
| 30-35 | 21 | 45 |
| 35-40 | 33 | 78 |
| 40-45 | 11 | 89 |
| 45-50 | 3 | 92 |
| 50-55 | 6 | 98 |
| 55-60 | 2 | 100 |
Now,
35-40 is the class whose cumulative frequency 78 is greater than and nearest to 50.
So, 35-40 is the median class.
Here, l=35, f=33, cf=45 and
h=40-35=5
∴ Median=
{
| वर्ग अंतराल | बारंबारता(f) | संचयी बारंबारता(cf) |
| 20 से कम | 2 | 2 |
| 20-25 | 4 | 6 |
| 25-30 | 18 | 24 |
| 30-35 | 21 | 45 |
| 35-40 | 33 | 78 |
| 40-45 | 11 | 89 |
| 45-50 | 3 | 92 |
| 50-55 | 6 | 98 |
| 55-60 | 2 | 100 |
अब,
35-40 वह वर्ग है जिसकी संचयी बारंबारता 78 है और वह 50 से अधिक और निकटतम है।
अतः माध्यक वर्ग=35-40
यहाँ, l=35, f=33, cf=45 और
h=40-35=5
∴ माध्यक=
}
9113323460

I hope you like it. If you like then please share it and you can also Donate to our website by my number and QR code which is given above.
Thanks.
Next Chapter Probability (प्रायिकता)
Previous ChapterSurface areas and volumes (पृष्ठीय क्षेत्रफल और आयतन)